lab16
Lab 16-1
Which anti-debugging techniques does this malware employ? What happens when each anti-debugging technique succeeds?
mov eax, large fs:30h
mov bl, [eax+2]
mov [ebp+var_1820], bl
movsx eax, [ebp+var_1820]
test eax, eax
jz short loc_403573
call sub_401000
loc_403573:
mov eax, large fs:30h
mov eax, [eax+18h]
db 3Eh
mov eax, [eax+10h]
mov [ebp+var_1824], eax
cmp [ebp+var_1824], 0
jz short loc_403594
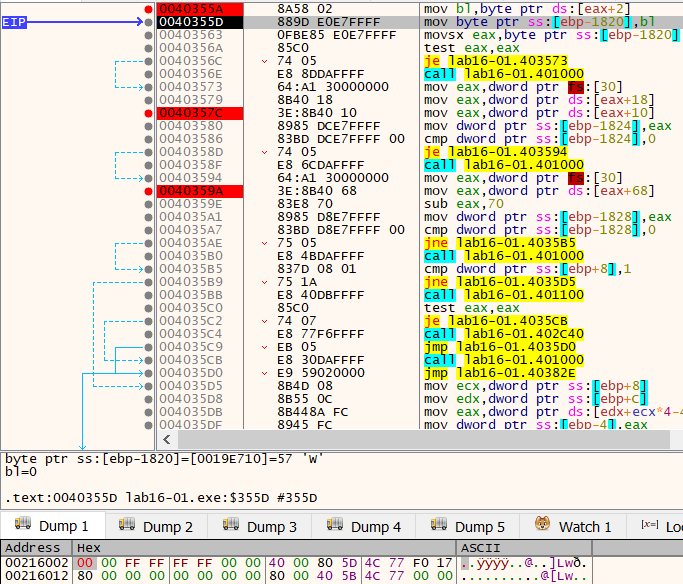
call sub_401000The first thing the malware does is verify that it is not being debugged by checking both the BeingDebugged flag and the ForceFlags field. It accesses the PEB using fs:30h twice.
The first access reads offset +2, which corresponds to the BeingDebugged flag. If this byte is non‑zero, a debugger is present.
The second access retrieves a structure at offset +18h of the PEB (the ProcessHeap pointer). From there, it reads offset +10h, which contains ForceFlags. If this value is non‑zero, the process was started with debug heap features enabled, which is a strong indicator of a debugger.
In both cases, if a debugger is detected, the malware calls sub_401000.
This function retrieves the running executable’s path, constructs the command:
cmd.exe /c del "malwarepath" >> NULand executes it using ShellExecuteA, effectively deleting itself from disk.
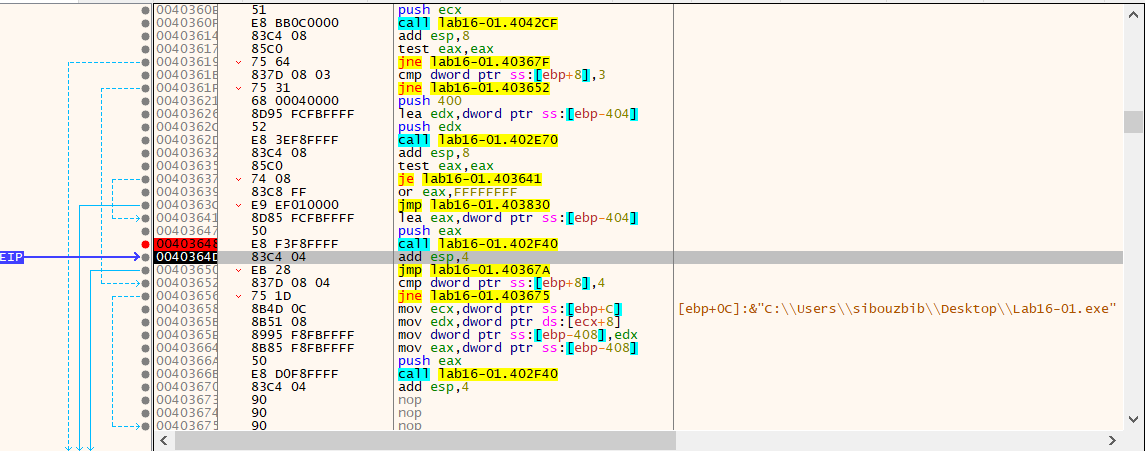
The next check compares NTGlobalFlag against the value 0x70. This is another debugger signature, since Windows enables the following flags when a process is launched under a debugger:
- FLG_HEAP_ENABLE_TAIL_CHECK
- FLG_HEAP_ENABLE_FREE_CHECK
- FLG_HEAP_VALIDATE_PARAMETERS
If these are set, the malware assumes a debugger is present and triggers self‑deletion again.
How can you get around these anti-debugging techniques?
One viable option is to manually NOP the jump and function calls that follow each anti‑debugging check. However, when cross‑referencing all self‑delete calls throughout the program, we find that the routine is invoked 78 times, and most of them are triggered as part of anti‑debugging logic.
Since the structure of each site is usually a conditional jump followed by a call to the same function, a better solution is to automate the process. We can search for all references to the self‑delete routine and patch both the call and the instruction right before it.
The following IDA Python script finds every call to selfdel and replaces both the previous instruction and the call with NOPs:
import idc
import idautils
import idaapi
import ida_bytes
import ida_idaapi

def nop_selfdel_calls():
    """
    Finds all calls to 'selfdel' and NOPs:
    1. The instruction immediately preceding the call
    2. The call instruction itself
    """
    target_name = "selfdel"
    target_ea = idc.get_name_ea_simple(target_name)

    if target_ea == ida_idaapi.BADADDR:
        print(f"[-] Error: Symbol '{target_name}' not found.")
        return

    print(f"[+] Target '{target_name}' found at {target_ea:#x}")
    patched = 0

    # Find all code references TO the selfdel function
    for ref_ea in idautils.CodeRefsTo(target_ea, 0):

        # Get the address of the instruction immediately before the call
        prev_ea = idc.prev_head(ref_ea)
        if prev_ea == ida_idaapi.BADADDR:
            print(f"[!] Warning: No previous instruction at {ref_ea:#x}, skipping.")
            continue

        # Calculate sizes
        prev_size = idc.get_item_size(prev_ea)
        call_size = idc.get_item_size(ref_ea)
        patch_start = prev_ea
        patch_len = prev_size + call_size

        print(f"[+] Patching {patch_len} bytes at {patch_start:#x} "
              f"(prev:{prev_size}b, call:{call_size}b)")

        # Patch with NOPs (0x90)
        for i in range(patch_len):
            ida_bytes.patch_byte(patch_start + i, 0x90)

        patched += 1

    idaapi.refresh_idaview_anyway()
    print(f"[+] Complete. Patched {patched} call site(s).")

nop_selfdel_calls()
This is easily implemented with a simple Python script. Once executed and the binary is saved, we obtain a patched version of the malware that is effectively blind to debuggers.
As a reminder, since the malware is from Lab 9, the program takes arguments and a password. To test whether the anti‑debugging was successfully bypassed, we run the malware with -in to install itself while staying inside the debugger.
I then break on the last instruction to ensure the control flow reaches and executes it. The execution completes successfully, and no anti‑debugging self‑destruct routine is triggered.
How do you manually change the structures checked during runtime?
One approach is to break on the first checks and, each time, modify the value being read so that future accesses return safe values, effectively hiding the debugger.
First, we change the BeingDebugged flag in the PEB to 0. Following the EAX+2 offset lands on the byte that is initially 0x01, indicating a debugger is attached.
Next, we attempt to update ForceFlags to 0. Initially, it was 0x10005F00. When it is blindly zeroed, the program crashes. This happens mainly because the code is outdated compared to modern Windows behavior.
On modern Windows versions, ForceFlags isn’t just a “debugger marker”; it participates in how Windows builds and manages the process heap. When a process starts under a debugger, Windows creates the heap with extra debug features and lays out memory blocks according to those flags.
By the time this code runs, the heap is already created using those settings. If ForceFlags is later modified to 0, Windows starts treating memory as if it were allocated differently than it actually was. This mismatch breaks the allocator’s assumptions and leads to crashes.
Therefore, on modern systems, this kind of manual runtime patching is generally not viable for ForceFlags.
Which OllyDbg plug-in will protect you from the anti-debugging techniques used by this malware?
Since patching the PEB at runtime is unreliable, we typically use ScyllaHide with x32dbg.
However, ScyllaHide actually fails against this malware because the anti‑debugging checks do not rely on APIs. Instead, the malware directly reads internal Windows structures (PEB → ProcessHeap → ForceFlags). These fields are initialized by the OS before the debugger and any user‑mode plug‑ins are loaded.
By the time ScyllaHide runs, the process heap has already been created with debug flags enabled, so the malware still sees a non‑zero value and detects the debugger. Because of this, the reliable approach is to patch the instructions performing the comparisons so the checks are skipped entirely.
Lab 16-2
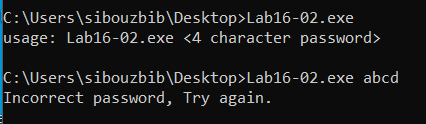
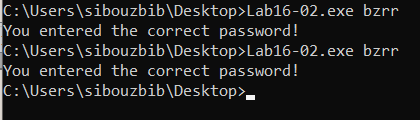
The program functions as a simple password checker. When executed from the command line, it expects a single argument, a four-character password. If you provide an incorrect guess, the program simply displays an “incorrect password” message and exits without revealing any additional information about the expected input.
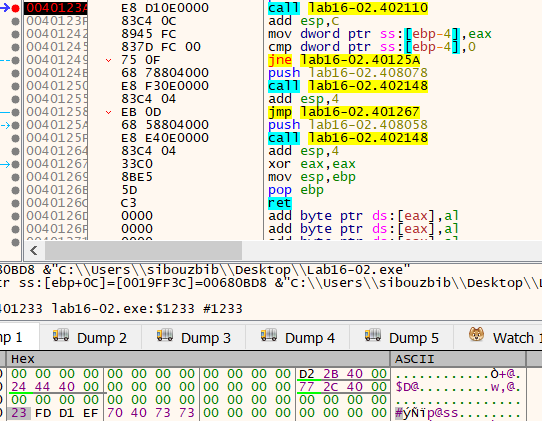
Loading the binary in IDA Pro reveals that the main function first creates a secondary thread via CreateThread, sleeps for one second, and then compares the user-provided command-line argument against a global buffer. If we ignore the thread creation and examine the global buffer directly in the data section, we initially find only two meaningful characters followed by what appears to be junk or uninitialized data.
The timing here is critical: the thread is spawned before the comparison, and the deliberate one-second sleep strongly suggests that this thread is responsible for initializing or decrypting the buffer that holds the correct password.
Upon closer inspection, the StartAddress passed to CreateThread resides not in the standard .text section, but in the .tls (Thread Local Storage) section. While .tls typically stores thread-local variables, code placed here often executes before the program’s entry point or serves as anti-analysis bait. In this case, the thread routine performs an elaborate decryption routine involving multiple rounds of bitwise operations on several global byte variables and a local buffer.
The most efficient approach to defeating this obfuscation is to allow the program to execute naturally in a debugger and inspect the decrypted buffer immediately before the string comparison occurs. However, there is a significant obstacle: the decryption routine incorporates an anti-debugging check.
At offset 0040112B, the code executes mov ebx, large fs:30h to retrieve the Process Environment Block (PEB), then reads the BeingDebugged flag at [ebx+2]. This boolean value (0 when not debugged, 1 when debugged) is added directly to the decryption key at byte_408032. This is a clever form of tamper resistance, the debug flag becomes part of the cryptographic material. If a debugger is present, the addition of 1 corrupts the internal state of the decryption algorithm, causing the final buffer to contain garbage rather than the legitimate password.
If we attempt to debug the program without hiding the debugger, the decrypted string is useless random data, making it impossible to deduce the correct password through static or dynamic analysis alone.
To bypass this protection, we must use an anti-anti-debugging tool such as the ScyllaHide plugin for x64dbg (or manually patch the BeingDebugged check). With the debugger successfully concealed, we can set a breakpoint just before the string comparison and examine the now-properly decrypted global buffer. The correct password is revealed to be “bzrr”.
Lab 16-3
Which strings do you see when using static analysis on the binary? What happens when you run this binary?
The only meaningful strings found statically are cmd.exe, >> NUL, and /c del. These suggest that the malware may attempt to delete itself silently if certain conditions are met, likely as part of an anti-debugging routine.
Running the malware normally produces no visible behavior. There are no network attempts, and Procmon shows no file writes or notable activity.
add     esp, 4
push    10Eh            ; nSize
lea     ecx, [ebp+Filename]
push    ecx             ; lpFilename
push    0               ; hModule
call    ds:GetModuleFileNameA
push    5Ch ; '\'       ; Ch
lea     edx, [ebp+Filename]
push    edx             ; Str
call    _strrchr
add     esp, 8
mov     [ebp+Str2], eax
push    104h            ; MaxCount
mov     eax, [ebp+Str2]
add     eax, 1
mov     [ebp+Str2], eax
mov     ecx, [ebp+Str2]
push    ecx             ; Str2
lea     edx, [ebp+fname]
push    edx             ; Str1
call    _strncmp
When loading the malware in IDA, the program retrieves its own filename and compares it to a local string, which is statically set to ocl.exe. Renaming the file to this value still does not change the behavior.
The filename buffer is passed through a function before the comparison, suggesting it may be altered at runtime. By breaking before the comparison in a debugger, we can inspect the stack to see the real value.
From the debugger, the buffer shows qgr.exe, but even renaming the binary to that still results in no activity.
lea     eax, [ebp+PerformanceCount]
push    eax             ; lpPerformanceCount
call    ds:QueryPerformanceCounter
Further analysis shows several anti-debugging techniques. First, the malware calls QueryPerformanceCounter, which retrieves a high-resolution timestamp representing how many CPU ticks have elapsed since boot. This value is stored for later comparison.
How must you rename the sample in order for it to run properly?
.text:00401223                 call    $+5
.text:00401228                 pop     eax
.text:00401229                 xor     ecx, ecx
.text:0040122B                 mov     edi, eax
.text:0040122D                 xor     ebx, ebx
.text:0040122F                 add     ebx, 2Ch ; ','
.text:00401232                 add     eax, ebx
.text:00401234                 push    eax
.text:00401235                 push    large dword ptr fs:0
.text:0040123C                 mov     large fs:0, esp
.text:00401243                 div     ecx
.text:00401245                 sub     edi, 0D6Ah
.text:0040124B                 mov     ecx, 0Ch
.text:00401250                 jmp     short loc_401262
.text:00401252 ; ---------------------------------------------------------------------------
.text:00401252                 repne stosb
.text:00401254                 mov     ecx, [esp-4+arg_8]
.text:00401258                 add     dword ptr [ecx+0B8h], 2
.text:0040125F                 xor     eax, eax
.text:00401261                 retn
.text:00401262 ; ---------------------------------------------------------------------------
.text:00401262
.text:00401262 loc_401262:                             ; CODE XREF: sub_4011E0+70↑j
.text:00401262                 pop     large dword ptr fs:0
.text:00401269                 pop     eax
This block sets up a Structured Exception Handler (SEH) trick. The instruction call $+5 pushes the next instruction address onto the stack and immediately pops it into EAX. That value is adjusted by 0x2C and pushed as a new SEH handler address.
The code then installs a new SEH entry and intentionally triggers a divide-by-zero exception with div ecx. Under normal execution, Windows dispatches the exception to the newly installed handler. However, if a debugger is attached, the debugger intercepts the exception first, altering the intended control flow.
At 00401254, the instruction:
mov ecx, [esp-4+arg_8]becomes important. In IDA, arg_8 is normally the second argument of the function (0x10 offset). However, inside an SEH handler, the stack layout is different. When Windows calls the exception handler, the stack contains OS-provided parameters instead of the function’s original arguments.
The layout places the CONTEXT pointer at esp+0Ch; IDA’s expression [esp-4+arg_8] becomes:
esp - 4 + 0x10 = esp + 0x0CSo this instruction actually loads the pointer to the CONTEXT structure supplied by Windows, not a real function argument.
When loading the CONTEXT structure, the offset ecx+0B8h resolves to CONTEXT.Eip. By adding 2 to it, the malware modifies the saved instruction pointer so execution skips the faulting div ecx instruction.
When the handler returns, Windows restores execution using the modified CONTEXT, and the program continues as if the crash never happened.
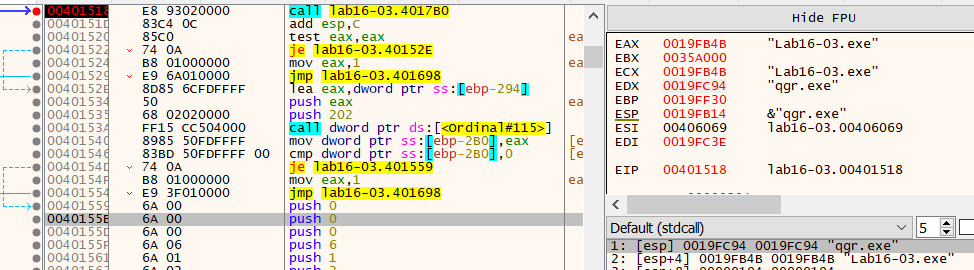
After returning, the code calls QueryPerformanceCounter again to capture an end timestamp. The difference between the two timestamps measures how long exception handling took.
This forms the core anti-debugging logic. Debuggers intercept or slow exception handling, causing the elapsed time to exceed a threshold (0x4B0, or 1200 ticks). If the time is too large, the malware sets var_118 to 2 instead of 1.
That variable is later used as a multiplier in a string decryption routine. If a debugger is present, the wrong multiplier corrupts the decrypted strings, including the filename, while the program continues running without obvious crashes.
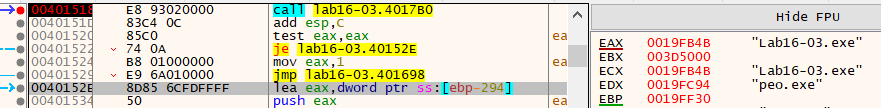
Nopping the instruction at 00401292:
mov [ebp+var_118], 2bypasses this check. Breaking on the strncmp afterward shows the correct filename should be peo.exe.
loc_401584:
call    ds:GetTickCount
mov     [ebp+var_2B4], eax
call    sub_401000
call    ds:GetTickCount
mov     [ebp+var_2BC], eax
mov     ecx, [ebp+var_2BC]
sub     ecx, [ebp+var_2B4]
cmp     ecx, 1
jbe     short loc_4015B7
Another timing check appears here. The malware measures how long sub_401000 takes to execute. That function uses the same SEH trick, which becomes slower under a debugger. If execution time exceeds a threshold, the program simply exits.
What domain name does this malware use?
call    sub_401300
add     esp, 0Ch
lea     edx, [ebp+name]
push    edx             ; name
call    ds:gethostbyname
Next, the malware prepares a DNS lookup. The hostname is built dynamically. Breaking before gethostbyname causes the malware to delete itself and exit.
Inside sub_401300, the timing check is implemented differently from the earlier logic that used QueryPerformanceCounter. Instead of calling a Windows API, the malware uses the CPU instruction rdtsc to directly read the processor’s timestamp counter.
rdtsc
push    eax
rdtsc returns the number of CPU cycles executed since reset, giving a very low-level, high-precision cycle count. Unlike QueryPerformanceCounter, which goes through the Windows kernel and can be virtualized or adjusted by the OS, rdtsc executes entirely in user mode and measures raw CPU behavior. This makes it more sensitive to debugger overhead.
The first rdtsc captures a starting cycle value before the SEH exception is triggered. After the divide-by-zero handler runs and execution resumes, the code samples the counter again:
rdtsc
sub     eax, [esp+20h+var_20]
mov     [ebp+var_4], eax
This subtraction computes how many CPU cycles were consumed while handling the exception. Any debugger involvement (breakpoints, exception interception, context inspection) increases this number significantly.
The result is compared against a fixed threshold:
cmp     [ebp+var_4], 7A120h
jbe     short loc_401385
call    sub_4010E0
If the cycle delta is too large, the malware assumes it is being debugged and jumps into the self-deletion routine.
In contrast, the earlier anti-debug check used QueryPerformanceCounter, which returns a high-resolution timestamp managed by Windows. While precise, it is still an OS-level abstraction. Using rdtsc bypasses the OS entirely and measures raw CPU cycles, making timing distortion caused by debuggers even easier to detect.
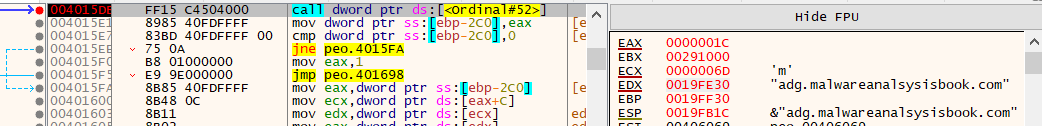
After bypassing all anti-debugging checks and breaking before DNS resolution, the command-and-control server is revealed:
adg.malwareanalysisbook.com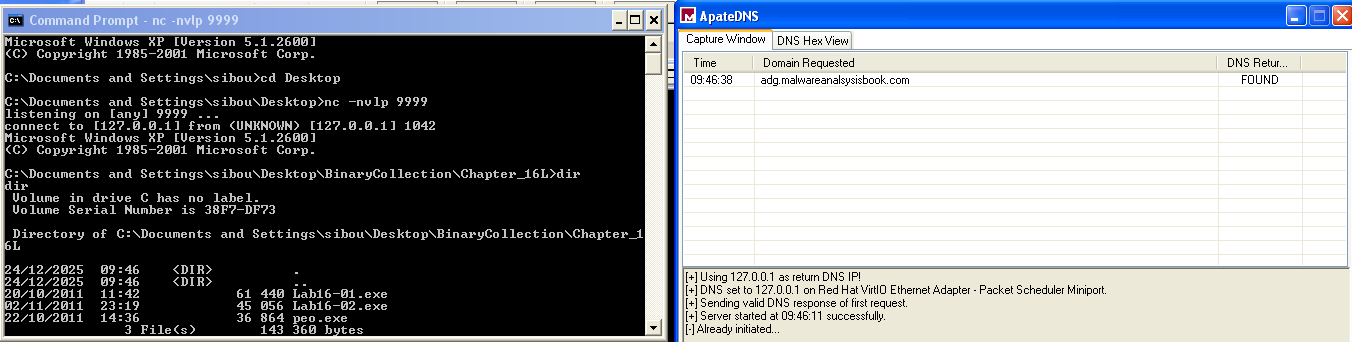
To confirm, the file was renamed to peo.exe and a listener was set on port 9999, which is the port used after DNS resolution. Immediately, the domain resolved and the listener received a reverse shell connection.