web-application-and-forensics-dashboard
8.1. overview
In distributed systems security, “Visibility is Security.” A powerful backend is useless if the administrator cannot visualize the threat landscape in real-time. To bridge the gap between the raw ACL telemetry of the JADE agents and the human operator, we developed the ASC Sentinel Dashboard.
Built on the Flask (Python) micro-framework, this web application is not merely a passive display; it is an active Forensic Intelligence Console. It was designed with a specific User Experience (UX) philosophy: “From Overview to Root Cause in 3 Clicks.”
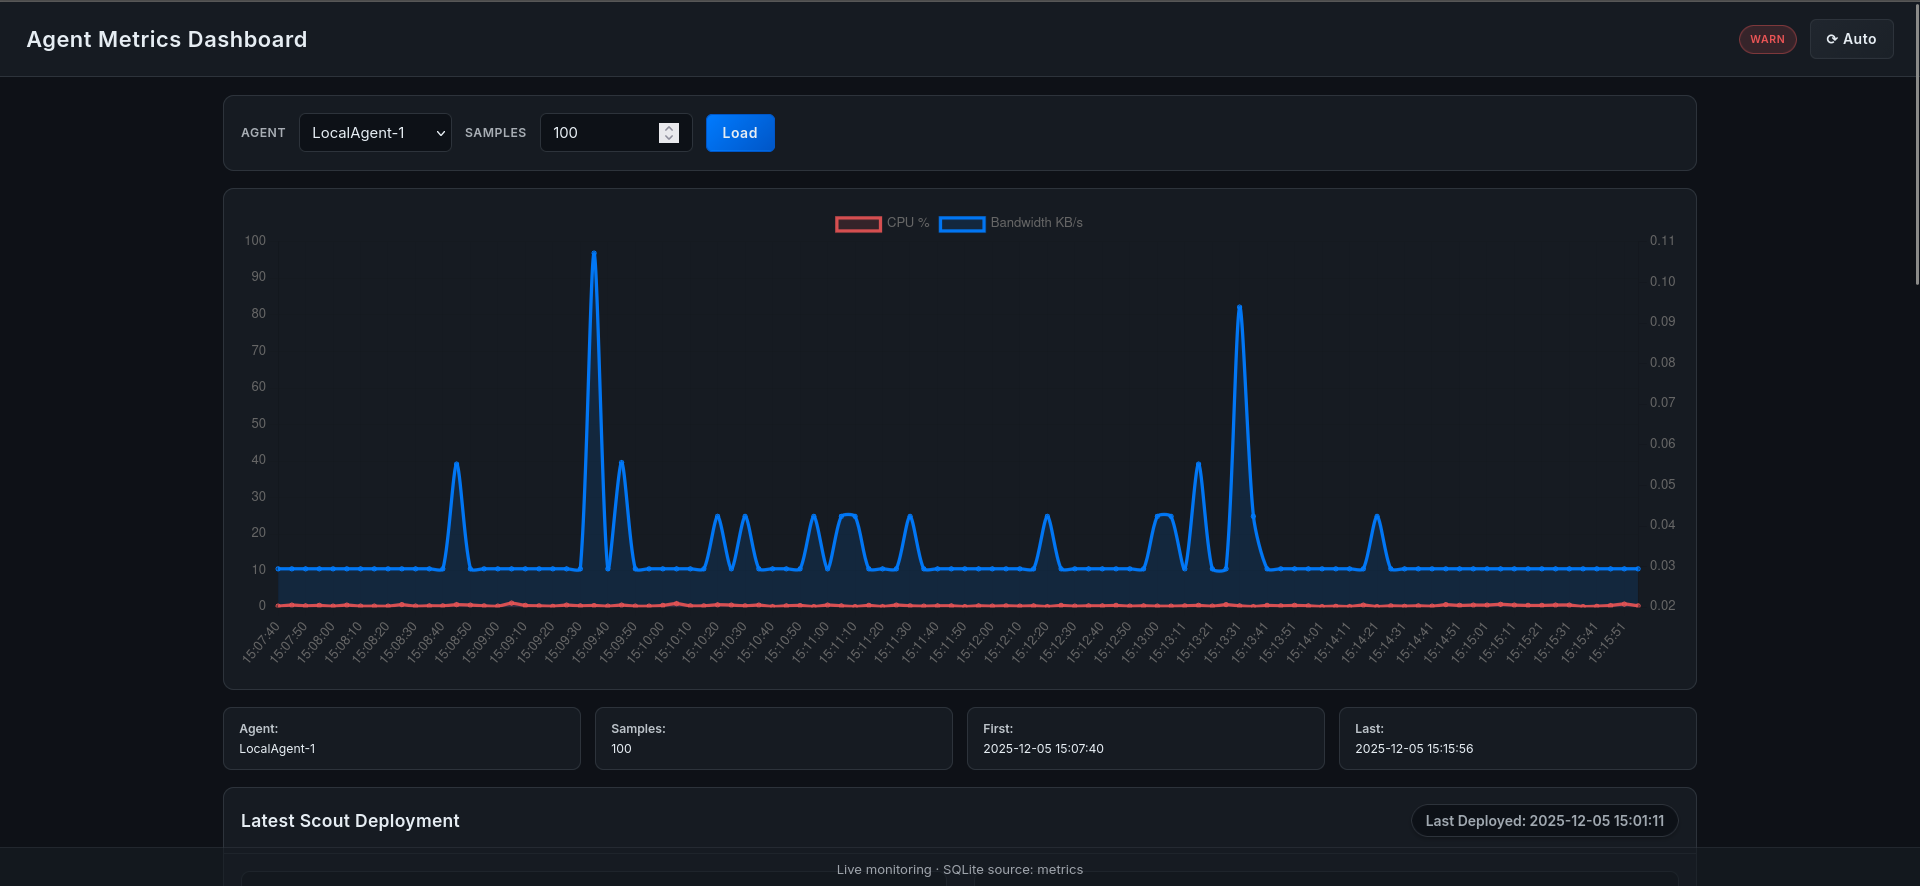
The dashboard provides a consolidated view of the entire GNS3 simulated network, offering real-time graphs, audit logs, and—most importantly—automated threat correlation.
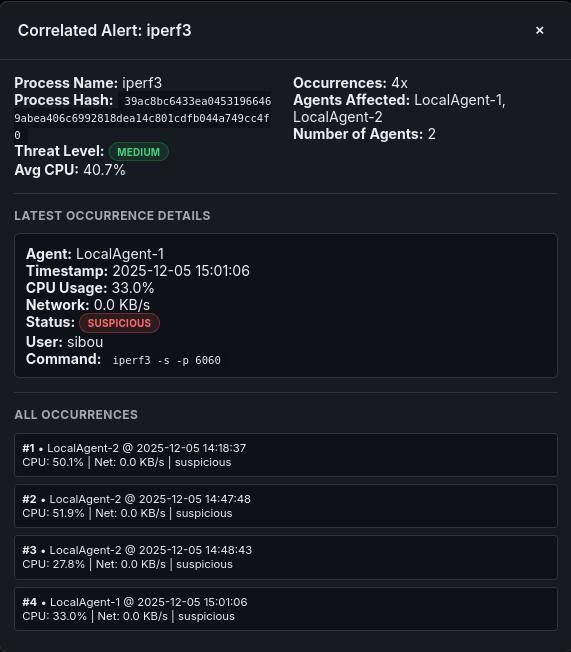
Figure 8.1: The Main Dashboard View, providing instant “Health-at-a-Glance” for all distributed nodes.
8.2. features and architecture
The application follows a Model-View-Controller (MVC) architecture, strictly decoupled from the JADE agents to ensure scalability.
8.2.1 Real-Time Telemetry Visualization
The dashboard utilizes Chart.js and AJAX polling to render live streams of CPU and Bandwidth usage.
- Scalability: The grid layout automatically adjusts. Whether monitoring 3 nodes or 300, the UI remains responsive.
- Visual Thresholds: Graphs automatically change color (Green to Orange to Red) as metrics approach the critical 80% threshold, drawing operator attention immediately.
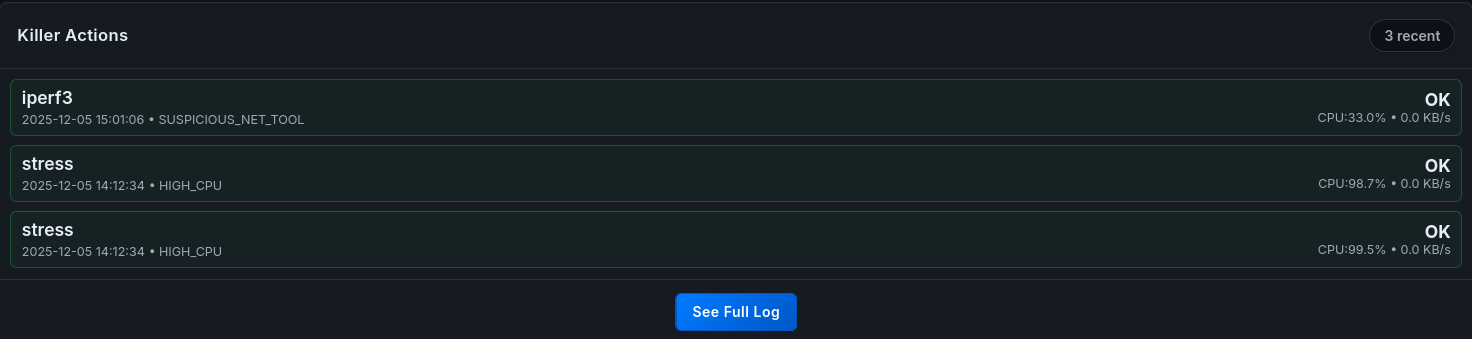
8.2.2 The “Kill Chain” Audit Log
Every action taken by a KillerAgent is immutable proof of a security incident. The dashboard presents a searchable, filterable table of these events.
- Forensic Utility: Administrators can filter by “Reason” (e.g., “Not Whitelisted”) to see patterns of attempted intrusions versus legitimate resource exhaustion.
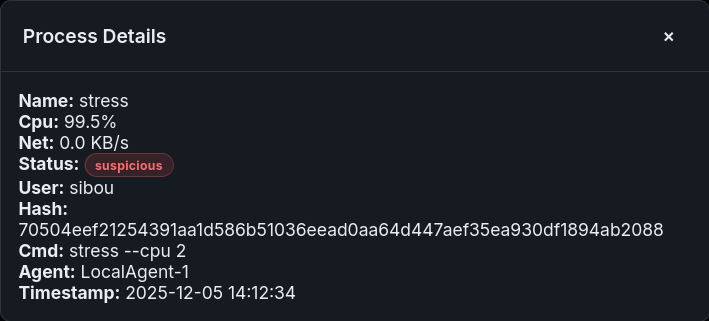
8.2.3 Deep Process Inspection (The Scout View)
When a ScoutAgent returns a report, the raw data is complex. The webapp parses this into a human-readable “Rap Sheet” for the target node, displaying the Top 5 consumers, their PIDs, Owners, and Command Lines.
8.3. correlation engine
As discussed in Section 6, we deliberately moved the complex analytical logic out of the Java Agents and into the Database/Web layer. This is the Correlation Engine, a set of SQL algorithms and Python logic that runs asynchronously to detect patterns that a single agent cannot see.
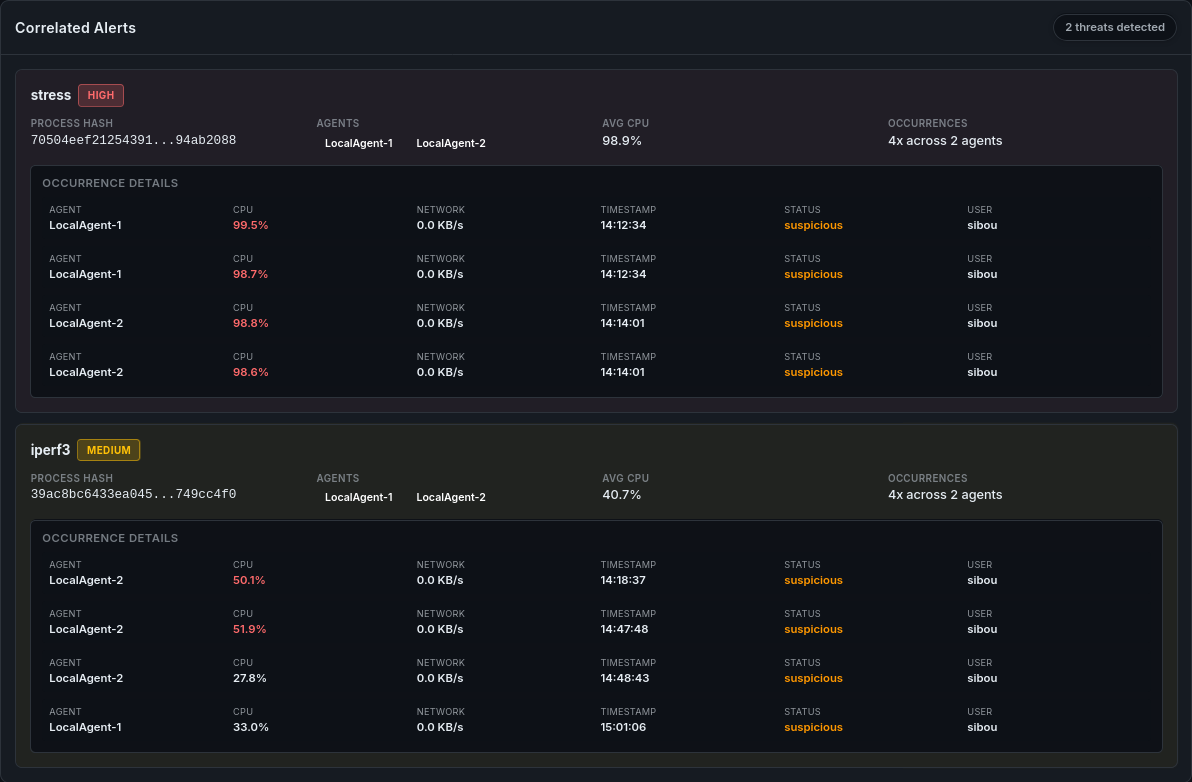
8.3.1 Logic A: Distributed Hash Fingerprinting (DHF)
The Problem: A malware infection is rarely isolated. If AL-1 is infected with a crypto-miner, AL-2 and AL-3 are likely next. The Solution: The engine queries the scout_reports table for identical process hashes appearing on multiple nodes within a short timeframe.
- Signal: “Process Hash a1b2… detected on 3 unique hosts.”
- Inference: This indicates a Worm-like propagation or a coordinated deployment of unauthorized software across the fleet.
8.3.2 Logic B: Name-Hash Mismatch (Masquerading Detection)
The Problem: Sophisticated malware often renames itself to java or sshd to hide in plain sight. The Solution: The engine compares the observed hash of a process name against a “Known Good” database of hashes for that binary.
- Signal: “Process named ‘sshd’ has Hash X, but standard ‘sshd’ is Hash Y.”
- Inference: Trojan / Masquerading Attack. The dashboard flags this with a critical “Integrity Violation” alert.
8.3.3 Logic C: Temporal Co-occurrence Analysis (TCA)
The Problem: Distributed Denial of Service (DDoS) attacks often involve multiple hijacked nodes spiking in network usage simultaneously. The Solution: We implemented a correlation function that scans for synchronized resource spikes.
def detect_synchronized_spikes(window_seconds=10):
    """Detects if > 50% of nodes breach thresholds within the same time window."""
    sql = """
    SELECT count(DISTINCT agent_name)
    FROM metrics
    WHERE bandwidth_usage > 2000
    AND timestamp > datetime('now', ?)
    """
# Logic to trigger a "Network-Wide Alert"- Inference: A synchronized spike suggests a Botnet C2 Command was issued to the fleet.
8.3.4 Logic D: User Privilege Anomaly Detection (UPAD)
The Problem: Web servers like apache2 or nginx should run as www-data. If they run as root, it implies a privilege escalation exploit. The Solution: The engine cross-references the User field from the Scout Report against a policy map.
- Signal: “Process ‘nginx’ detected running as user ‘ROOT’ on AL-2.”
- Inference: Rootkit / Privilege Escalation. The dashboard highlights this row in red, prioritizing it over simple CPU exhaustion issues.
8.4. secure deployment (HTTPS)
In a forensic environment, the dashboard itself must be tamper-proof. Serving it over HTTP would allow an attacker to spoof alerts. We secured the application using TLS/SSL.
Configuration Steps:
- Certificate Generation: We generated a self-signed SHA-256 certificate for the internal management IP.
openssl req -x509 -newkey rsa:4096 -keyout key.pem -out cert.pem -days 365 - Flask SSL Context: We modified the entry point app.py to enforce the secure context.
if __name__ == '__main__':
    # Enforce TLS 1.2+
    ssl_context = ('cert.pem', 'key.pem')
    app.run(host='0.0.0.0', port=5000, ssl_context=ssl_context)
This ensures that even if the admin accesses the dashboard from a compromised Wi-Fi network, the forensic data remains confidential.
8.5. limitations and roadmap
While the ASC Sentinel Dashboard represents a significant leap forward in visualizing agent-based telemetry, no system is without boundaries. We have identified specific technical limitations and architected a roadmap for the next generation of the platform.
8.5.1 Current Limitations
- SQLite Concurrency: The current database engine is serverless. While excellent for prototyping, it lacks row-level locking. In a scenario with >100 agents reporting simultaneously, write-lock contention could cause data gaps. Fix: Migration to PostgreSQL with TimescaleDB extension.
- Polling Latency: The dashboard uses AJAX polling (pull) every 2 seconds. This introduces a slight “visibility lag.” Fix: Implementing WebSockets (via Flask-SocketIO) to push metrics from the Central Agent to the browser in real-time (sub-millisecond latency).
8.5.2 Future Horizon: The “Cognitive SOC” Roadmap
We propose five ambitious features to transform this tool from a dashboard into an autonomous Cognitive Security Operations Center (CSOC).
1. AI-Powered “SentinelGPT” (LLM Integration)
Concept: Integrating a Local Large Language Model (e.g., Llama-2 or Mistral) directly into the dashboard. Implementation: Utilizing RAG (Retrieval-Augmented Generation) on the SQL database and logs. Use Case: Instead of writing complex SQL queries, the Admin interacts via Natural Language:
Admin: “Sentinel, show me all nodes that had a CPU spike correlated with the ‘xmrig’ process signature in the last 24 hours.” Bot: “I found 3 instances on AL-1 and AL-2. Here is the timeline and the calculated hash variance.”
2. Immersive 3D Topology (Digital Twin)
Concept: Replacing 2D charts with a WebGL/Three.js 3D visualization of the network topology. Implementation: Nodes would be represented as floating cubes in 3D space, connected by lines representing network links. Use Case: Volumetric Heatmaps. The “height” of a node could represent CPU load, and the “thickness” of the link lines could represent bandwidth usage. This allows an analyst to spot a “DDoS Mountain” (a cluster of high-traffic nodes) instantly in a dense network.
3. Predictive “Time-to-Failure” Analytics
Concept: Moving from Reaction to Prediction using Time-Series Forecasting. Implementation: Integrating Python libraries like Prophet or ARIMA to analyze the slope of resource usage. Use Case: The system detects a slow memory leak in a Java process on AL-3. It predicts: “Critical Memory Failure in 4 hours 12 minutes.” The system then preemptively creates a ticket or restarts the service before the crash occurs.
4. Automated Defense Playbooks (SOAR)
Concept: Security Orchestration, Automation, and Response. Implementation: A “Drag-and-Drop” logic builder in the UI. Use Case: Creating a policy: IF (Process == ‘unknown’) AND (Connection == ‘Russia’) THEN (Trigger ‘BlockIP_Agent’). This allows complex, multi-step defense maneuvers to be executed automatically by the agent swarm without human intervention.
5. Cryptographic Audit Trails (Immutable Logs)
Concept: Ensuring the integrity of the killer_actions log against insider threats. Implementation: Chaining the hash of each log entry to the previous one (Blockchain-lite architecture). Use Case: If a rogue administrator tries to delete a record of a legitimate process they killed by mistake, the chain validation will fail, flagging the tampering attempt. This ensures the dashboard meets strict compliance standards (GDPR/ISO 27001).