testing-and-demonstration
To validate the functional integrity of our Distributed Anomaly Detection System (DADS), we conducted a series of live experiments covering the full “Detect-Audit-Remediate” cycle. The following section details the behavior of the Web Application and the Agent System under various stress scenarios.
1. Web Application Overview & Navigation
Upon launching the ASC Sentinel Dashboard, the administrator is presented with a global view of the network. The interface allows for real-time selection and monitoring of specific Local Agents.
- Global Grid: Displays the health status of all connected agents (AL-1, AL-2, AL-3).
- Agent Detail View: Clicking on AL-1 isolates its telemetry, showing granular CPU and Network history.
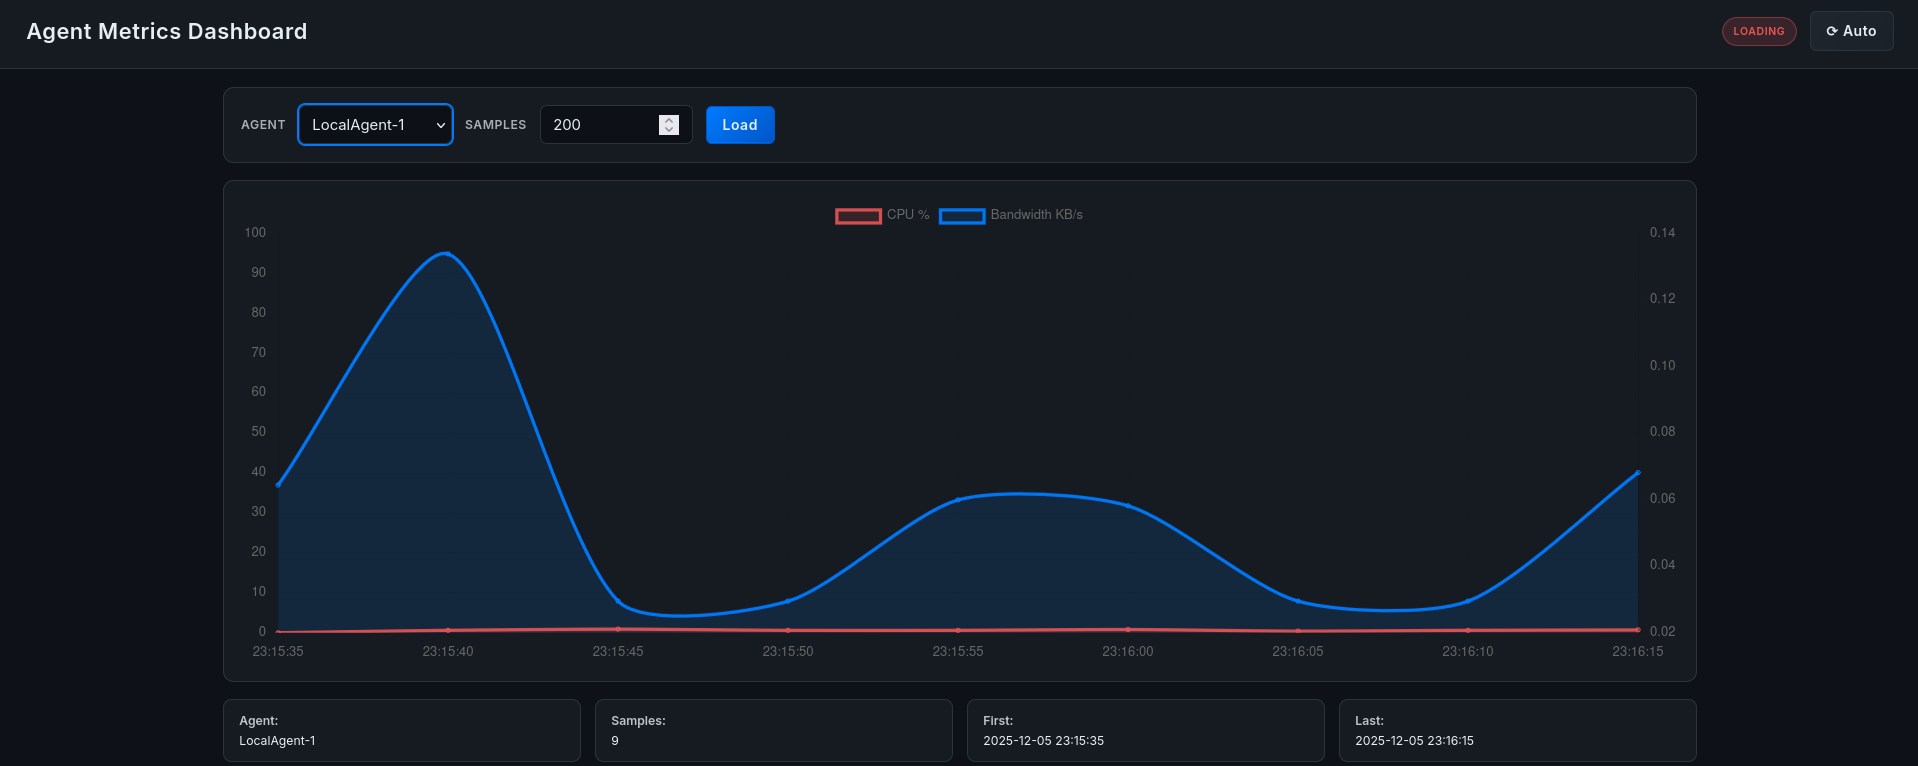 Figure 9.1: dashboard main menu.
2. Scenario A: CPU Anomaly Detection (Stress Test)
In this scenario, we simulate a standard resource exhaustion attack on AL-1 using the stress tool.
Execution: We execute the following command on the AL-1 virtual machine:
stress --cpu 2 --timeout 60sObservation:
- Dashboard Reaction: The real-time graph for AL-1 immediately spikes from <1% to 100% CPU usage. The node indicator turns RED.
- Mitigation: Within seconds, the graph plummets back to normal levels, indicating successful termination.
- Forensics: A new entry appears in the “Killer Actions” log.
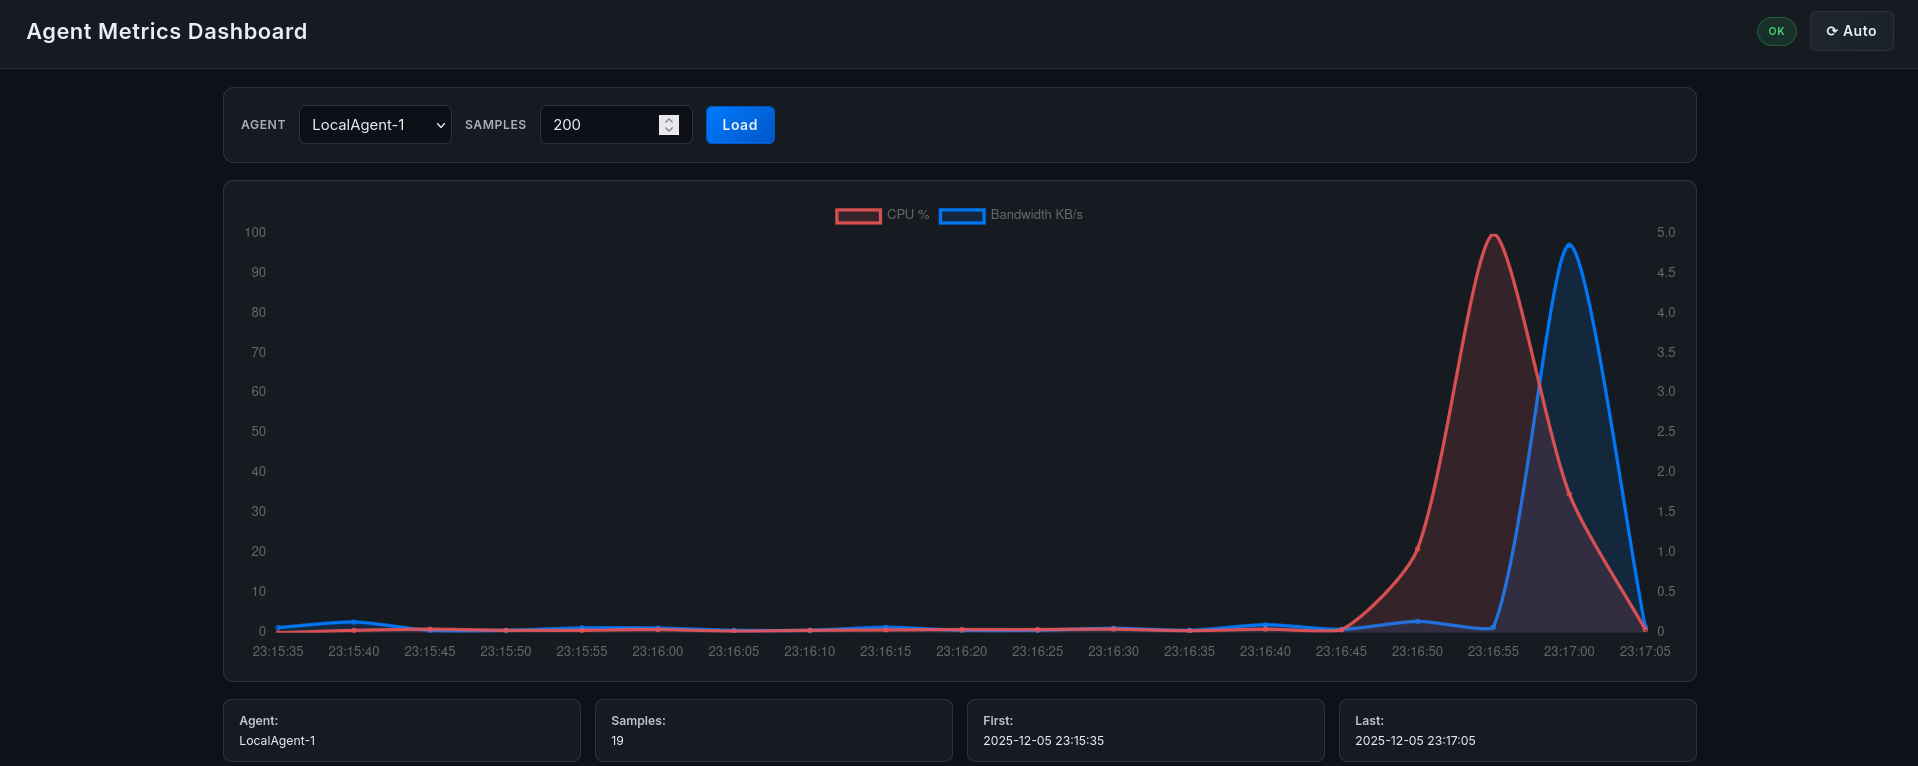 Figure 9.2: telemetry during stress test.
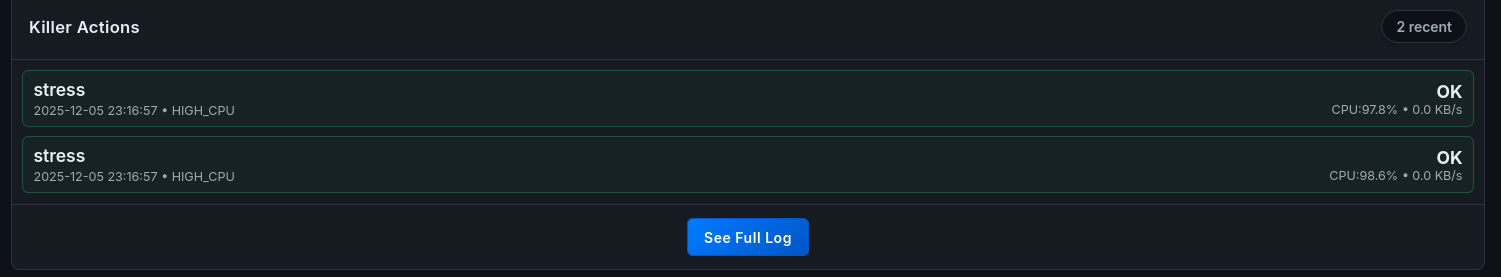 Figure 9.3: audit log entry.
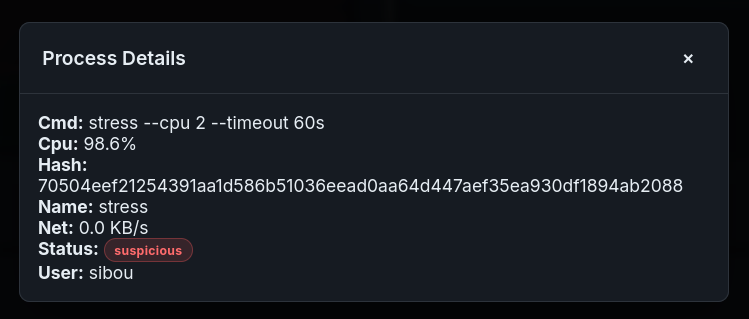 Figure 9.4: process details
3. Scenario B: Network Congestion Analysis (Iperf3)
To test the system’s ability to handle network anomalies, we generated high-bandwidth traffic between AL-2 and the Central Server.
Execution:
# On Server (Receiver)
iperf3 -s

# On AL-2 (Sender)
iperf3 -c 10.100.0.1 -t 30 -u -b 100M
Observation: The Dashboard’s Network graph accurately reflects the throughput spike (100 MB/s). Crucially, because the process causing the traffic was whitelisted (simulating legitimate VoIP), the system did not kill the process but flagged it for review, demonstrating the whitelist logic’s effectiveness.
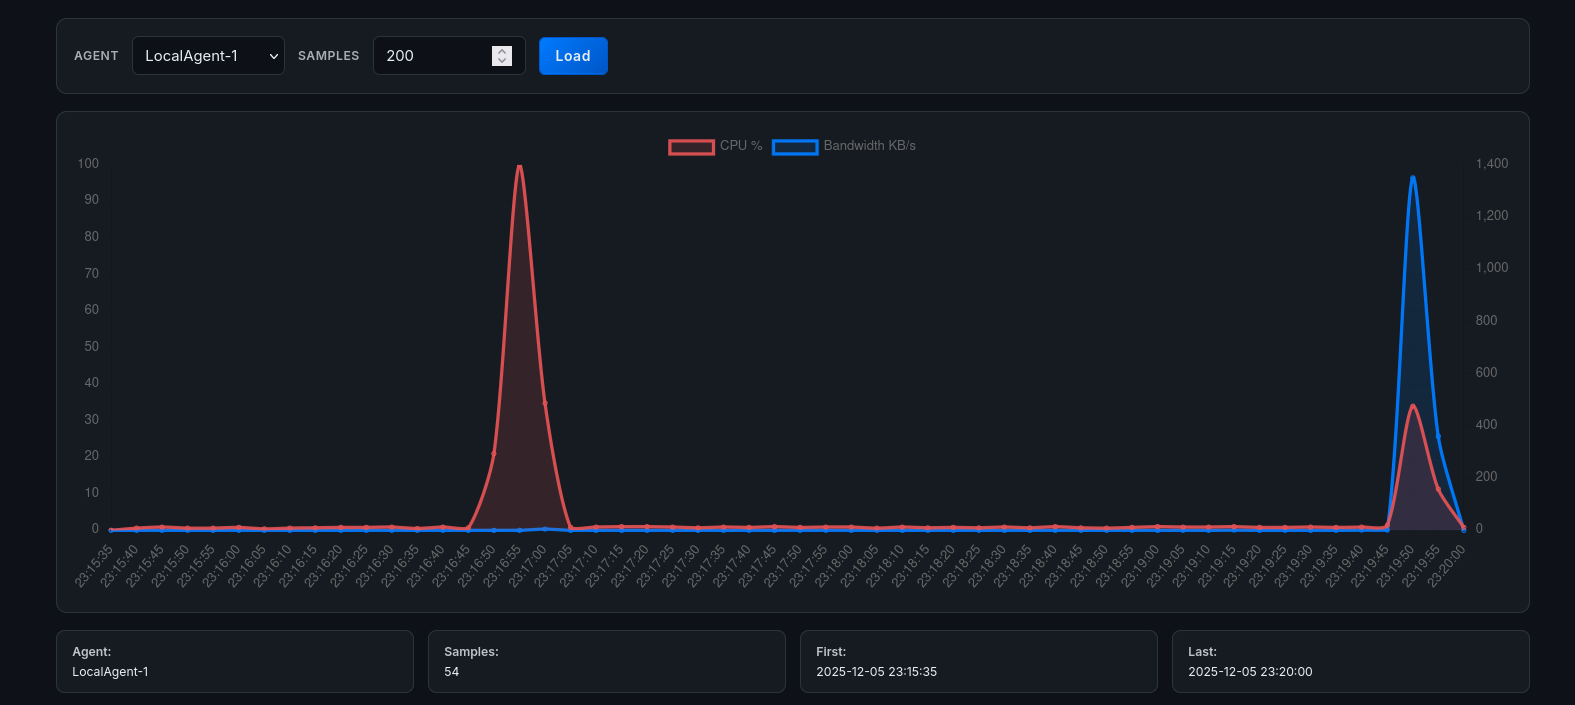 Figure 9.5: bandwidth monitoring during iperf3.
4. Scenario C: Distributed Attack Correlation
A key feature of our system is the ability to detect coordinated attacks. We simulated a simultaneous load on AL-1 and AL-3.
Execution: We ran stress instances on both nodes within a 5-second window.
Observation: The Correlation Engine on the dashboard identified the temporal proximity of these events. A “Correlation Alert” was generated, suggesting a potential orchestrated attack or botnet activation.
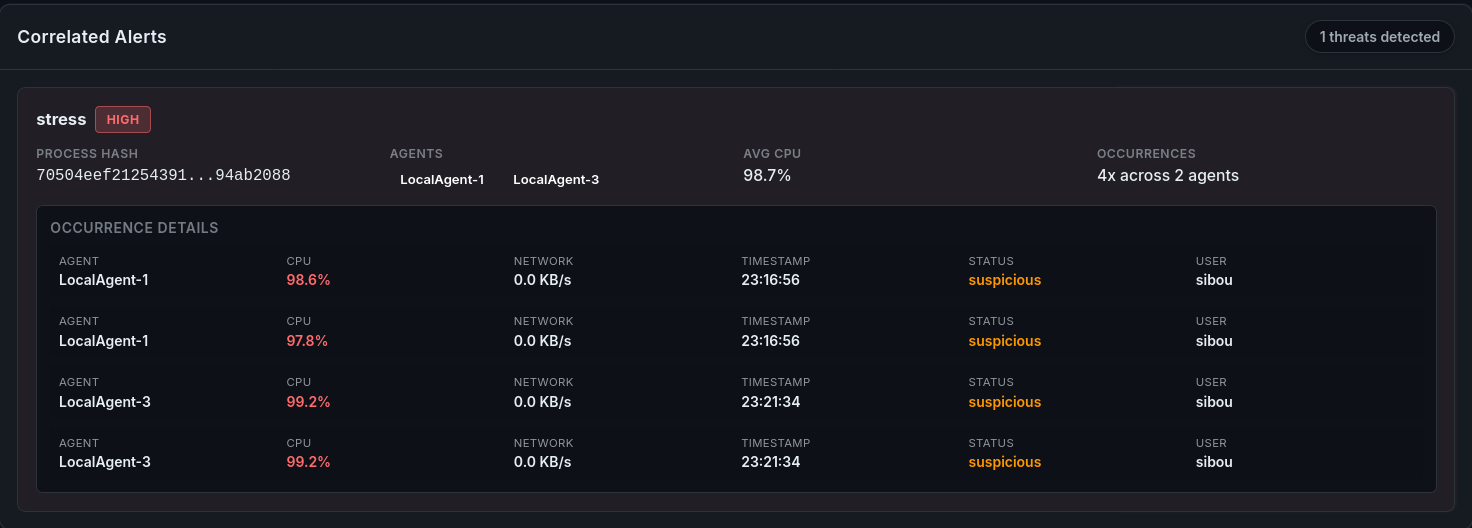 Figure 9.6: correlation alert for synchronized load.
5. Scenario D: The “Imposter Process” (Integrity Violation)
This experiment highlights the limitation of name-based whitelisting and validates the need for the Hash-Based Verification proposed in our roadmap.
Execution:
- Legitimate Run: We ran a certified script named Update. The system whitelisted it correctly.
#include <stdio.h>
#include <pthread.h>

void* burn_cpu(void* arg) {
    while (1) {
        // Busy loop to keep CPU occupied
    }
    return NULL;
}

int main() {
    printf("Sys Update....\n");

    pthread_t t1, t2;
    pthread_create(&t1, NULL, burn_cpu, NULL);
    pthread_create(&t2, NULL, burn_cpu, NULL);

    pthread_join(t1, NULL);
    pthread_join(t2, NULL);

    return 0;
}- Tampering: We modified the script to print a different string (simulating malware injection) but kept the filename Update.
- Malicious Run: We executed the tampered script.
Observation: The Central Agent allowed the process to run because the name was in the whitelist. However, the Forensic Dashboard, which cross-references the file hash returned by the ScoutAgent against the known-good database, triggered a Critical Integrity Violation alert.
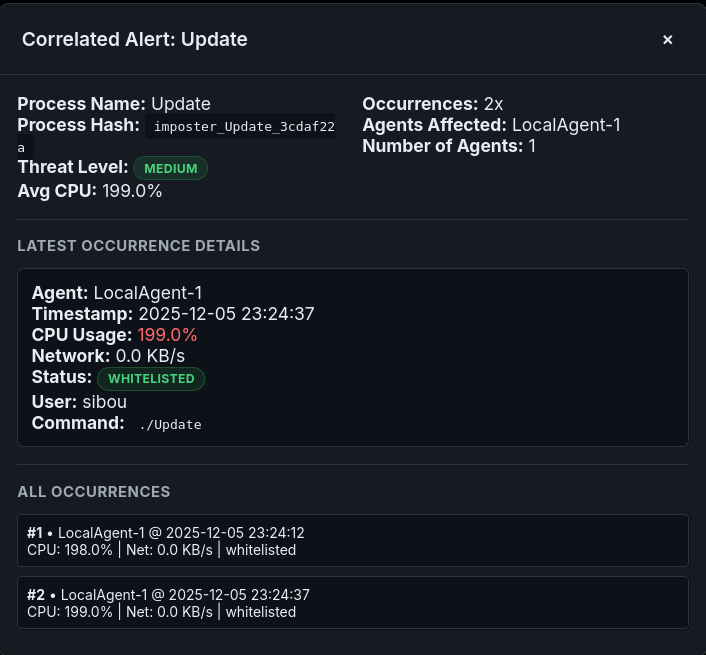 Figure 9.7: integrity violation via hash analysis.
This confirms that while the Agent’s reaction speed is vital, the Forensic Layer provides the deep inspection necessary to catch sophisticated “Masquerading” attacks.